
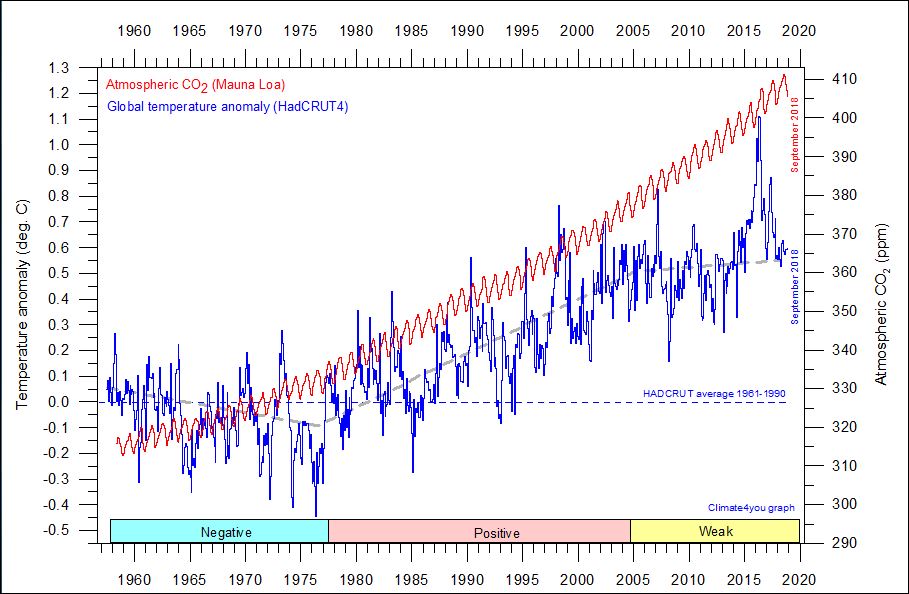
Scroll down for separate 2018 HadCRUT4 chart. Above, 1960-2018 approximately 58 years, relation of Mauna Loa global CO2 measurement vs HadCRUT4 global temperatures (combined land and sea surface). About 30 of the 58 years show weak or negative relationship between CO2 and temperatures. 28 years on average show a relationship. Conclusions: Not enough to claim that human caused CO2 is a deadly substance or that US taxpayers-or anyone else-should be punished in perpetuity for its existence. However, the temporary US political class felt differently, decided in 1990 to permanently convert US taxpayers to global slavery because they had used too much CO2. Temporary politicians said that yearly and in perpetuity US taxpayers must pay billions to the world. No opportunity for parole. No matter how much we pay, it will never be enough. To this day, millions of US tax dollars are diverted daily to the imaginary CO2 danger industry. As everyone knows, global CO2 is controlled by China. Never once in 28 years has a politician suggested we should pay even ten cents less.
1960-1977: 17 years=No relation between CO2 and global temperatures
1978-2004: 26 years=Overall relation appears between CO2 and global temperatures
2005-2018: 13 years=Weak relation between CO2 and global temperatures
“Diagram showing the HadCRUT4 monthly [alternate link: https://crudata.uea.ac.uk/~timo/diag/tempthisyear.htm] global surface air temperature estimate (blue) and the monthly atmospheric CO2 content (red) according to the Mauna Loa Observatory, Hawaii. The Mauna Loa data series begins in March 1958, and 1958 has therefore been chosen as starting year for the diagram. Reconstructions of past atmospheric CO2 concentrations (before 1958) are not incorporated in this diagram, as such past CO2 values are derived by other means (ice cores, stomata, or older measurements using different methodology), and therefore are not directly comparable with modern atmospheric measurements. The dotted grey line indicates the approximate, overall linear temperature development, and the boxes in the lower part of the diagram indicate the relation between atmospheric CO2 and global surface air temperature, negative or positive. Last month shown: September 2018. Last diagram update: 27 October 2018.”
.........
Added: Following is “HadCRUT4 global temperature” chart for Jan.-Sept. 2018. Black line shows flat 2018 temperatures, ie no increase in global temperatures in 2018 through Sept.:

(Note: October 2018 HadCRUT4 may be available from its website for those interested. The above was the most I was able to download from the site}
…………………………..
Added: Below, Mauna Loa global CO2, 1959 through October 2018, posted Nov. 7, 2018:
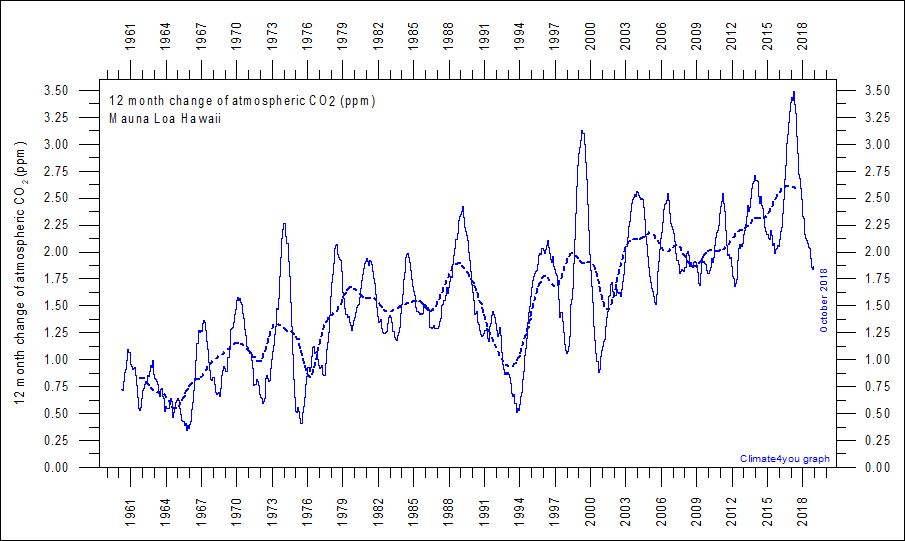
“Annual (12 month) growth rate (ppm) of atmospheric CO2 since 1959, calculated as the average amount of atmospheric CO2 during the last 12 months, minus the average for the preceding 12 months. The graph is based on data measured at the Mauna Loa Observatory, Hawaii. Data are reported as a dry mole fraction defined as the number of molecules of carbon dioxide divided by the number of molecules of dry air (water vapour removed), multiplied by one million (ppm). The thin blue line shows the value calculated month by month, while the dotted blue line represents the simple running 3 year average. Last month shown: October 2018. Last diagram update: 7 November 2018.
- Click here to download the entire series of monthly CO2 values since March 1958.
- Click here to compare with sea surface temperature.
- Click here to read paper on the phase relation between atmospheric CO2 and global temperature.
- Click here to read about data smoothing.”
Added: “Climate action” via US taxpayer dollars exploded in 1990 and has continued (This chart, page 4, pdf, is an underestimate, doesn’t include congressional appropriations):
Fall 2015, “Causes and Consequences of the Climate Science Boom,“ independent.org, Butos and McQuade

“Note and Sources: The data shown here are funding disbursements by the White House U.S. Global Change Research Program and its predecessor, the National Climate Program, available at NCP 1988, 43; Climate Science Watch 2007; and Leggett, Lattanzio, and Bruner 2013. These data, however, do not represent congressional climate science funding appropriations to other government agencies. As we show later in a more detailed assessment of U.S. government climate science funding, the numbers here, especially those for more recent years, greatly underestimate the actual level of funding.” pdf p. 4
“Government policies and funding as well as the emergence of a scientific “Big Player” [UN IPCC] that has aggressively championed the hypothesis of anthropogenic global warming (AGW)1, the United Nations Intergovernmental Panel on Climate Change (IPCC), have together fomented a boom in climate science that began in the early 1990s and has grown markedly over the past decade.”…

Screen shot of Bush #1, “George HW Bush New World Order quotes“ via You Tube
About: Climate4You website proprietor: Ole Humlum, is an Emeritus Professor, Dept. of Geoscience, University of Oslo, Norway, (English translation)….original Norwegian
Ole Humlum is Danish
Click here for bibliography
………………
............
No comments:
Post a Comment