
Republican Stauber 52, Democrat Radinovich 32, error margin 12 points, NY Times-Siena College Polls, Minnesota’s 8th Congressional District
10/12/18, “We’ll resume polling in Minnesota’s 8th Congressional District soon.“ NY Times Upshot
 “It was one of the most reliably Democratic districts of the 20th century. Now Democrats are just trying to hold on.…No battleground district [in Nov. 2016] swung more from Barack Obama to Donald Trump.…
.......
11% undecided
32% Joe Radinovich [Democrat], Fmr. State Rep.
About the race
It’s generally best to look at a single poll in the context of other polls:
How our poll result has changed:
As we reach more people, our poll will become more stable and the margin of sampling error will shrink. The changes in the timeline below reflect that sampling error, not real changes in the race.
All estimates based on 288 interviews.
........
Just because one candidate leads in all of these different turnout scenarios doesn’t mean much by itself. They don’t represent the full range of possible turnout scenarios, let alone the full range of possible election results.
The types of people we’ve reached so far:
Here, we’re weighting by age, estimated party, gender, likelihood of voting, race, education and region, mainly using data from voting records files compiled by L2, a nonpartisan voter file vendor.
But weighting works only if you weight by the right categories and you know what the composition of the electorate will be. In 2016, many pollsters didn’t weight by education and overestimated Hillary Clinton’s standing as a result.
Even after weighting, our poll does not have as many of some types of people as we would like. Here are other common ways to weight a poll: Our poll under different weighting schemes
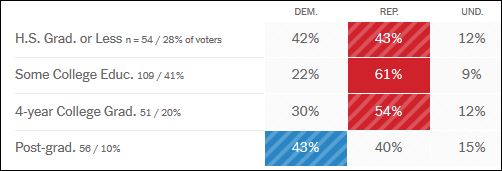
What different types of voters said… Results among subgroups may not be representative or reliable. Be especially careful with groups with fewer than 100 respondents, shown here in stripes.”… “Education”…
………

“About this poll
10/12/18, “We’ll resume polling in Minnesota’s 8th Congressional District soon.“ NY Times Upshot
 “It was one of the most reliably Democratic districts of the 20th century. Now Democrats are just trying to hold on.…No battleground district [in Nov. 2016] swung more from Barack Obama to Donald Trump.…
.......
2016 Trump +16
2012 Obama +6…
52% Pete Staubach [Republican], City Commissioner2012 Obama +6…
We’ve made 10,459 calls, and 288 people have spoken to us so far.
.......
.......
11% undecided
32% Joe Radinovich [Democrat], Fmr. State Rep.
Pete Stauber, the Republican candidate, [endorsed by Trump] leads our poll so far….
About the race
-
Joe Radinovich is a 32-year-old former state representative, first elected to the Minnesota House at 26. He was the campaign manager of the current representative. 36% favorable rating; 33% unfavorable; 32% don’t knowBased on 288 interviews
-
Pete Stauber is a member of the St. Louis County Commission, a retired police lieutenant and a former college hockey star. He played for a Detroit Red Wings minor league affiliate. 44% favorable rating; 23% unfavorable; 33% don’t knowBased on 288 interviews
-
We polled this district Sept. 6-9, showing [Radinovich 44, Stauber 43, a statistical tie, with a 9 point margin of error] a close race.
-
Just 23 percent of adults have a college degree, and 94 percent of eligible voters are white.
- [“Just” 23%? So what? Nationally, “just” 30% have college degrees. 70% do not.]
| 2016 President | +16 Trump |
| 2012 President | +6 Obama |
It’s generally best to look at a single poll in the context of other polls:
| Polls | Dates | Radinovich | Stauber | Margin |
|---|---|---|---|---|
| Victoria Research and Consulting (D.) n = 400 lv | Sept. 27-30 | 45% | 44% | Radinovich +1 |
| Siena College/New York Times 504 lv | Sept. 6-9 | 44% | 43% | Radinovich +1 |
How our poll result has changed:
As we reach more people, our poll will become more stable and the margin of sampling error will shrink. The changes in the timeline below reflect that sampling error, not real changes in the race.
The margin of sampling error on the overall lead is 12 points,
roughly twice as large as the margin for a single candidate’s vote
share. One reason we’re doing these surveys live is so you can see the
uncertainty for yourself.
But sampling error is not the only type of error in a poll.
Our turnout model
There’s a big question on top of the standard margin of error in a poll: Who is going to vote? It’s a particularly challenging question this year, since special elections have shown Democrats voting in large numbers.To estimate the likely electorate, we combine what people say about how likely they are to vote with information about how often they have voted in the past. In previous races, this approach has been more accurate than simply taking people at their word. But there are many other ways to do it. Our poll under different turnout scenarios
| Who will vote? | Est. turnout | Our poll result |
|---|---|---|
| People who say they are almost certain to vote, and no one else | 234k | Stauber +19 |
| The types of people who voted in 2014 | 260k | Stauber +21 |
| Our estimate | 307k | Stauber +20 |
| People whose voting history suggests they will vote, regardless of what they say | 310k | Stauber +20 |
| People who say they will vote, adjusted for past levels of truthfulness | 318k | Stauber +19 |
| The types of people who voted in 2016 | 338k | Stauber +23 |
| Every active registered voter | 379k | Stauber +21 |
All estimates based on 288 interviews.
........
The types of people we’ve reached so far:
Based on administrative records. Some characteristics are missing or incorrect. Many voters are called multiple times.
Pollsters compensate by giving more weight to respondents from under-represented groups.
Pollsters compensate by giving more weight to respondents from under-represented groups.
Here, we’re weighting by age, estimated party, gender, likelihood of voting, race, education and region, mainly using data from voting records files compiled by L2, a nonpartisan voter file vendor.
But weighting works only if you weight by the right categories and you know what the composition of the electorate will be. In 2016, many pollsters didn’t weight by education and overestimated Hillary Clinton’s standing as a result.
Even after weighting, our poll does not have as many of some types of people as we would like. Here are other common ways to weight a poll: Our poll under different weighting schemes
| Our poll result | |
|---|---|
| Weight using census data instead of voting records, like most public polls | Stauber +12 |
| Our estimate | Stauber +20 |
| Don’t weight by education, like many polls in 2016 | Stauber +20 |
| Don’t weight by estimated party, like most public polls | Stauber +20 |
- Most responses shown here are delayed about 30 minutes. Some are delayed longer for technical reasons.
- About 5 percent of the voters in our poll said that they would vote for a third-party candidate. They are not shown here.
- The design effect of this poll is 1.33. That’s a measure of how much weighting we are doing to make our respondents resemble all voters.
- Read more about the methodology for this poll.
This survey was conducted by The New York Times Upshot and Siena College.
Data collection by Reconnaissance Market Research, M. Davis and Company, the Institute for Policy and Opinion Research at Roanoke College, the Survey Research Center at the University of Waterloo, the University of North Florida and the Siena College Research Institute.” Map of Minnesota at top of post from NY Times
Data collection by Reconnaissance Market Research, M. Davis and Company, the Institute for Policy and Opinion Research at Roanoke College, the Survey Research Center at the University of Waterloo, the University of North Florida and the Siena College Research Institute.” Map of Minnesota at top of post from NY Times
.............
No comments:
Post a Comment