.
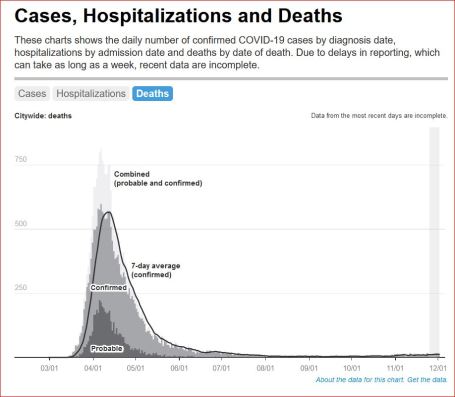
NY City, “Covid 19, Total Data, Summary, as of December 5, at 1 p.m.”
“Covid 19 data: Long-Term Trends"
NY City has obediently kept its curve “flattened” for six months:
“This page includes data visualizations. To view data tables and data definitions, visit our Github repository. The data here show COVID-19 trends in New York City since the city’s first confirmed case was diagnosed on February 29.”
…………………………………..


No comments:
Post a Comment