July 3, 2020, “CovidView Weekly Summary,” cdc.gov
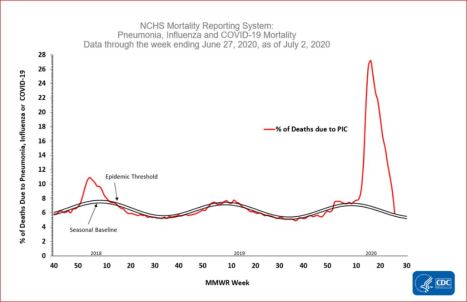
CDC chart below: Lower left of chart in 2018 when no epidemic existed is labeled “Epidemic Threshold." Follow red line across to right side of chart to July 2020. The red line today is in the same place it was with no epidemic in 2018:

..........
(To see this chart, scroll to near end of page): “Mortality surveillance:”
“The National Center for Health Statistics (NCHS) collects death certificate data from vital statistics offices for all deaths occurring in the United States. Based on death certificate data available on July 2, 2020, 5.9% of all deaths occurring during the week ending June 27, 2020 (week 26) were due to [one of three causes:] pneumonia, influenza or COVID-19 (PIC). This is the tenth consecutive week of a declining percentage of deaths due to PIC. The percentage is equal to the epidemic threshold of 5.9% for week 26.”
Translation of “Epidemic threshold:“ Point when it’s no longer an epidemic, as is clearly visible on above CDC chart. According to CDC chart, US has as much “epidemic” today as it did in 2018.
……………….
At top of CDC page: “Key Updates for Week 26, ending June 27, 2020:″…
“Mortality attributed to COVID-19 decreased compared to last week and is currently at the epidemic threshold.”…
……………………..
Added: Additional reference to “Epidemic threshold:"
“Epidemic threshold“ from WebMD.com:
“The CDC’s definition of a flu epidemic relates to the percentage of deaths in a given week caused by influenza and pneumonia. The “epidemic threshold” is a certain percentage above what is considered normal for that period. The normal level, or baseline, is statistically determined based on data from past flu seasons.”
……………………………Added: Additional reference to “Epidemic threshold:"
“Epidemic threshold“ from WebMD.com:
“The CDC’s definition of a flu epidemic relates to the percentage of deaths in a given week caused by influenza and pneumonia. The “epidemic threshold” is a certain percentage above what is considered normal for that period. The normal level, or baseline, is statistically determined based on data from past flu seasons.”
Added: From CDC, best news of all is about children vs Covid-19:
July 3, 2020, “CovidView Weekly Summary," cdc.gov
(subhead) “Key points”
(scroll down): “For children (0-17 years), cumulative COVID-19 hospitalization rates are much lower than cumulative influenza hospitalization rates at comparable time points* during recent influenza seasons….“*Number of weeks since 10% of specimens tested positive for SARS-CoV-2 and influenza, respectively.”…
........

No comments:
Post a Comment