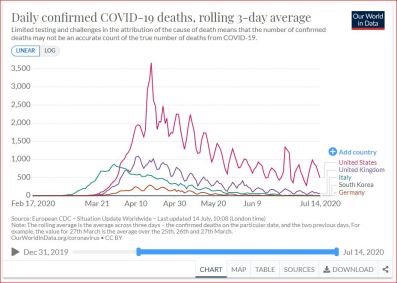
Globally “the peak of the pandemic has passed, COVID-related deaths have dramatically decreased,” per July 14, 2020, Our World in Data chart. US CDC chart posted below.

..........
Above, July 14, 2020, “Daily confirmed COVID-19 deaths, rolling 3-day average,” ourworldindata.org
Above chart shows that for 6-8 weeks, Germany, Italy, and UK have been near normal. US peak was 3 months ago on April 17, US CDC chart posted below shows epidemic no longer exists in US.
Source: “European CDC.” “European Centre for Disease Prevention and Control (ECDC). Link https://github.com/owid/covid-19-data/tree/master/public/data...Funding, Bill Gates et al.
……………….
Added: CDC published data shows Covid epidemic in US has ended as of 7/3/20. Per CDC chart below, US is now at 2018 levels:

To see above chart on CDC website, scroll to near end of page: “Mortality surveillance.”
July 3, 2020, “CovidView Weekly Summary,” cdc.gov
Lower left of chart in 2018 when no epidemic existed is labeled “Epidemic Threshold.“ Follow red line across to right side of chart to July 2020. The red line today is in the same place it was with no epidemic in 2018.…
“The National Center for Health Statistics (NCHS) collects death certificate data from vital statistics offices for all deaths occurring in the United States. Based on death certificate data available on July 2, 2020, 5.9% of all deaths occurring during the week ending June 27, 2020 (week 26) were due to [one of three causes:] pneumonia, influenza or COVID-19 (PIC). This is the tenth consecutive week of a declining percentage of deaths due to PIC. The percentage is equal to the epidemic threshold of 5.9% for week 26.”
Meaning of “Epidemic threshold:“ Point when it’s not or is no longer an epidemic, as is clearly visible on above CDC chart. Per CDC chart, US has same “epidemic” today as it did in 2018. At top of CDC page: “Key Updates for Week 26, ending June 27, 2020"...”Mortality attributed to COVID-19 decreased compared to last week and is currently at the epidemic threshold.”…
……………………………………
Added: On misuse of the word “cases” from Swiss Policy Research, July 2020:
Misuse and weaponization of the word “cases” grew with increase in “tests” in low-risk general populations. “Cases” in this context are often incorrectly “equated with sick or infected people.“… Swiss Policy Research, July 2020.…(See also: Suffolk County, NY State, removed 2105 positive tests from previous tally. Some tests didn’t differentiate “virus-killing antibodies that patients’ immune systems develop after becoming infected.".June 3, 2020, “New Suffolk virus tracking system leads to reduction of 2,105 positive tests,” Newsday, Matt Clark)
“July 2020…
After the end of the lockdowns, the number of corona tests in the low-risk general population has increased strongly in many countries, for example in connection with people returning to work and school.
This led to a certain increase in positive test results in some countries or regions, which was portrayed by many media and authorities as an allegedly dangerous increase in “case numbers” and sometimes led to new restrictions, even if the rate of positive tests remained very low.
“Case numbers” are, however, a misleading figure that cannot be equated with sick or infected people. A positive test can, for example, be due to non-infectious virus fragments, an asymptomatic infection, a repeated test, or a false-positive result.
Moreover, counting alleged “case numbers” is not meaningful simply because antibody tests and immunological tests have long shown that the new coronavirus is up to fifty times more widespread than assumed on the basis of daily PCR tests.
Rather, the decisive figures are the number of sick people, hospitalisations and deaths. It should be noted, however, that many hospitals are now back to normal operation and all patients, including asymptomatic patients, are additionally tested for the coronavirus. Therefore, what matters is the number of actual Covid patients in hospitals and ICUs.
In the case of Sweden, for example, the WHO had to withdraw the classification as a “risk country” after it became clear that the apparent increase in “cases” was due to an increase in testing. In fact, hospitalisations and deaths in Sweden have been declining since April.
Some countries have already been in a state of below-average mortality since May. The reason for this is that the median age of corona deaths was often higher than the average life expectancy, as up to 80% of deaths occurred in nursing homes.
In countries and regions where the spread of the coronavirus has so far been greatly reduced, it is nevertheless entirely possible that there will be a renewed increase in Covid patients. In these cases, early and effective treatment is important....
Global Covid-19 mortality is currently – despite the significantly older population nowadays – a whole order of magnitude below the flu pandemics of 1957 (Asian flu) and 1968 (Hong Kong flu) and in the range of the rather mild “swine flu pandemic” of 2009.”…
…………………………………………
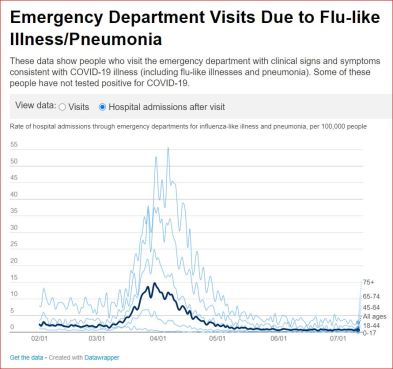
Added: Near normal in NY City for over two months as of 7/13/20. ER visits with respiratory complaints near normal for over two months in NY City, early May to early July, 2020:
As of 7/13/20, “Emergency Department Visits Due to Flu-like Illness/Pneumonia,” nyc.gov
Chart below: Near normal ER visits for over two months, early May to mid July:
“These data show people who visit the emergency department with clinical signs and symptoms consistent with COVID-19 illness (including flu-like illnesses and pneumonia). Some of these people have not tested positive for COVID-19.”

Chart below, as of 7/13/20, Hospital admissions following “Emergency Department Visits Due to Flu-like Illness/Pneumonia:”
Near normal hospital admissions for over two months, early May to mid July, after visiting “emergency department with clinical signs and symptoms consistent with COVID-19 illness (including flu-like illnesses and pneumonia). Some of these people have not tested positive for COVID-19.”

………………
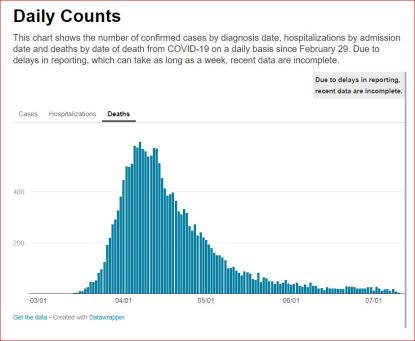
Added: Chart below, NY City has 8 consecutive weeks of very few Covid related deaths, mid-May to mid July 2020. On July 11, 2020, there were zero Covid deaths in NY City.

Above NYC.gov chart shows deaths as of July 13, 2020, “Daily Counts; This chart shows the number of confirmed cases by diagnosis date, hospitalizations by admission date and deaths by date of death from COVID-19 on a daily basis since February 29. Due to delays in reporting, which can take as long as a week, recent data are incomplete.”
.........

No comments:
Post a Comment