
Global Temperatures for past 420,000 years to the present: Climate4You, Ole Humlum, and ArcticHERO…..Ole Humlum, English translation: Professor Emeritus, University of Oslo, Dept. of Geosciences.….“The present interglacial is about 2oC colder than the previous interglacial, even though the atmospheric CO2 concentration now is about 100 ppm higher. …Other phenomena than atmospheric CO2 must have had the main control on global temperature for the last 11,000 years.”...
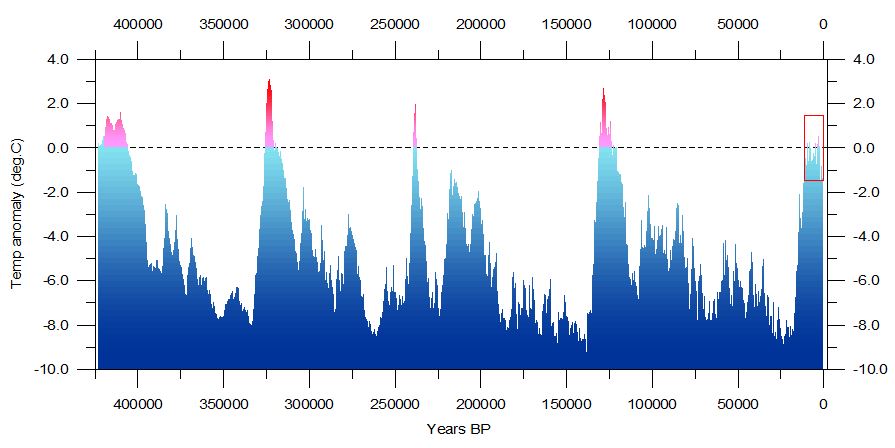
Caption for above: “Fig.2. Reconstructed global temperature over the past 420,000 years based on the Vostok ice core from the Antarctica (Petit et al. 2001). The record spans over four glacial periods and five interglacials, including the present. The horizontal line indicates the modern temperature. The red square to the right indicates the time interval shown in greater detail in the following figure. [fig. 3 below]”
“The diagram above (Fig.2) shows a reconstruction of global temperature based on ice core analysis from the Antarctica. The present interglacial period (the Holocene) is seen to the right (red square). The preceding four interglacials are seen at about 125,000, 280,000, 325,000 and 415,000 years before now, with much longer glacial periods in between. All four previous interglacials are seen to be warmer (1-3oC) than the present. The typical length of a glacial period is about 100,000 years, while an interglacial period typical lasts for about 10-15,000 years. The present interglacial period has now lasted about 11,600 years.
According to ice core analysis, the atmospheric CO2 concentrations during all four prior interglacials never rose above approximately 290 ppm; whereas the atmospheric CO2 concentration today stands above 400 ppm (by volume or molecular fraction, as of 2018). The present interglacial is about 2oC colder than the previous interglacial, even though the atmospheric CO2 concentration now is about 100 ppm higher.
The last 11,000 years (red square in diagram above) of this climatic development is shown in greater detail in the diagram below (Fig.3) [two diagrams, temp. followed by CO2], representing the main part of the present interglacial period.”

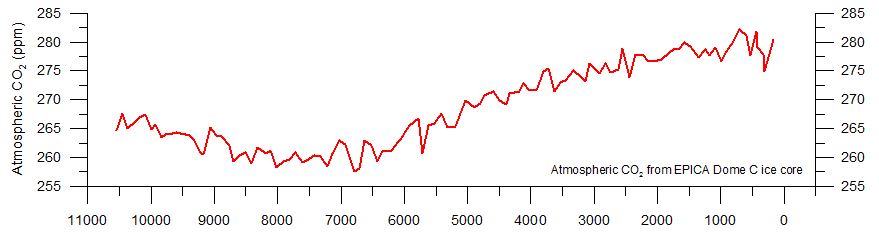
Caption for above: “Fig.3. The upper panel shows the air temperature at the summit of the Greenland Ice Sheet, reconstructed by Alley (2000) from GISP2 ice core data. The time scale shows years before modern time. The rapid temperature rise to the left indicate the final part of the even more pronounced temperature increase following the last ice age. The temperature scale at the right hand side of the upper panel suggests a very approximate comparison with the global average temperature (see comment below). The GISP2 record ends around 1854, and the two graphs therefore ends here. There has since been an temperature increase to about the same level as during the Medieval Warm Period and to about 395 ppm for CO2. The small reddish bar in the lower right indicate the extension of the longest global temperature record (since 1850), based on meteorological observations (HadCRUT3). The lower panel shows the past atmospheric CO2 content, as found from the EPICA Dome C Ice Core in the Antarctic (Monnin et al. 2004). The Dome C atmospheric CO2 record ends in the year 1777.”
“The diagram above (Fig.3) shows the major part of the present interglacial period, the Holocene, as seen from the summit of the Greenland Ice cap. The approximate positions of some warm historical periods are shown by the green bars, with intervening cold periods.
Clearly Central Greenland temperature changes are not identical to global temperature changes. However, they do tend to reflect global temperature changes with a decadal-scale delay (Box et al. 2009), with the notable exception of the Antarctic region and adjoining parts of the Southern Hemisphere, which is more or less in opposite phase (Chylek et al. 2010) for variations shorter than ice-age cycles (Alley 2003). This is the background for the very approximate global temperature scale at the right hand side of the upper panel. Please also note that the temperature record ends in 1854 AD, and for that reason is not showing the post Little Ice Age temperature increase. In the younger part of the GISP2 temperature reconstruction the time resolution is around 10 years. Any comparison with measured temperatures should therefore be made done using averages over periods of similar lengths.
During especially the last 4000 years the Greenland record is dominated by a trend towards gradually lower temperatures, presumably indicating the early stages of the coming ice age (Fig.3). In addition to this overall temperature decline, the development has also been characterised by a number of temperature peaks, with about 950-1000 year intervals. It may even be speculated if the present warm period fits into this overall scheme of natural variations.
The past temperature changes show little (if any) relation to the past atmospheric CO2 content as shown in the lower panel of figure 3. Initially, until around 7000 yr before now, temperatures generally increase, even though the amount of atmospheric CO2 decreases. For the last 7000 years the temperature generally has been decreasing, even though the CO2 record now display an increasing trend. Neither is any of the marked 950-1000 year periodic temperature peaks associated with a corresponding CO2 increase. The general concentration of CO2 is low, wherefore the theoretical temperature response to changes in CO2 should be more pronounced than at higher concentrations, as the CO2 forcing on temperature is decreasing logarithmic with concentration.
Nevertheless, no net effect of CO2 on temperature can be identified from the above diagram, and
it is therefore obvious that significant climatic changes can occur
without being controlled by atmospheric CO2.
Other phenomena than atmospheric CO2 must have had the main control on global temperature for the last 11,000 years.”...
………………
Updated as of 9/11/2018, “Global Temperatures,” Climate4You.com
Climate4Youhomepage
About Climate4You website:
“Climate science remains a highly complex issue where simplification tends to lead to confusion, and where understanding requires knowledge, openness to new hypotheses, thought and effort.
The present website is under continuous development, and updates and new material will be added whenever possible, relevant or needed. A list of the latest key updates are shown in the lower part of the panel to the left.
Thank you for your interest.
Yours sincerely, Ole Humlum and ArcticHERO
English translation, About Ole Humlum
Click here for bibliography.”
...........
No comments:
Post a Comment