
"The lowest favorable rating for Russia–24% in 2015.”
March 5, 2018, “Americans, Particularly Democrats, Dislike Russia," Gallup, by Megan Brenan
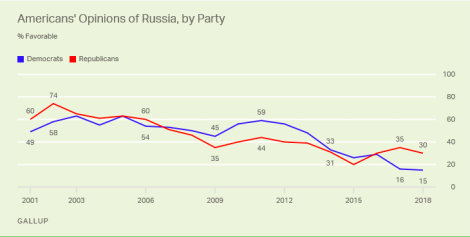
Most recent Gallup survey on Russia favorability was taken Feb. 1-10, 2018 and published March 5, 2018 by Gallup. The poll queried the general population, no filter was added for Likely Voters or Registered Voters. Charts below show 2001-2018 ratings. From Gallup:
“The lowest favorable rating for Russia–24% in 2015.”
Per Gallup charts below:
2009: Favorable 40, Unfavorable 53
2015: Favorable 24, Unfavorable 70
Chart shows most of the change occurred from 2012-2015, during Obama’s second term:
2009-2015: 40% decrease in favorability
2009-2015: 51% increase in unfavorability
………………..
2017: Favorable 28, Unfavorable 70
2018: Favorable 25, Unfavorable 72
Gallup says the 2 point move from 70 to 72 above, 2017 to 2018, is statistically insignificant, “statistically unchanged from last year’s [2017] 70%.”
Based on available Gallup data, 24/7 media incitement of Russiagate hysteria and general anti-Russia alarmism have had little effect on Americans’ views of Russia either positively or negatively. At minimum, it’s clear that the vast majority of anti-Russia sentiment was in place by 2015:

……………………………….
Gallup error margins: 4% for total audience; 6%-8% for samples of self described Republicans, independents and Democrats:
“Survey Methods
March 5, 2018, “Americans, Particularly Democrats, Dislike Russia," Gallup, by Megan Brenan
Most recent Gallup survey on Russia favorability was taken Feb. 1-10, 2018 and published March 5, 2018 by Gallup. The poll queried the general population, no filter was added for Likely Voters or Registered Voters. Charts below show 2001-2018 ratings. From Gallup:
“The lowest favorable rating for Russia–24% in 2015.”
Per Gallup charts below:
2009: Favorable 40, Unfavorable 53
2015: Favorable 24, Unfavorable 70
Chart shows most of the change occurred from 2012-2015, during Obama’s second term:
2009-2015: 40% decrease in favorability
2009-2015: 51% increase in unfavorability
………………..
2017: Favorable 28, Unfavorable 70
2018: Favorable 25, Unfavorable 72
Gallup says the 2 point move from 70 to 72 above, 2017 to 2018, is statistically insignificant, “statistically unchanged from last year’s [2017] 70%.”
Based on available Gallup data, 24/7 media incitement of Russiagate hysteria and general anti-Russia alarmism have had little effect on Americans’ views of Russia either positively or negatively. At minimum, it’s clear that the vast majority of anti-Russia sentiment was in place by 2015:


……………………………….
Gallup error margins: 4% for total audience; 6%-8% for samples of self described Republicans, independents and Democrats:
“Survey Methods
Results for this Gallup poll are based on telephone interviews conducted Feb. 1-10, 2018, with a random sample of 1,044 adults, aged 18 and older, living in all 50 U.S. states and the District of Columbia. For results based on the total sample of national adults, the margin of sampling error is ±4 percentage points at the 95% confidence level. For results based on the samples of Republicans, independents and Democrats, the margins of sampling error are between ±6 and ±8 percentage points at the 95% confidence level. All reported margins of sampling error include computed design effects for weighting.
Each sample of national adults includes a minimum quota of 70% cellphone respondents and 30% landline respondents, with additional minimum quotas by time zone within region. Landline and cellular telephone numbers are selected using random-digit-dial methods.
View survey methodology, complete question responses and trends.
Learn more about how the Gallup Poll Social Series works.”
.................
No comments:
Post a Comment