
.
 As of 1/13/22, “Trends and Totals,” New York City Board of Health
Map: 5 boroughs of New York City…Below are charts for each borough’s confirmed and probable COVID-19 deaths as of 1/13/22: Bronx, Brooklyn, Manhattan, Queens, and Staten Island. Total NY City graph also posted below.


![New York State and region].](https://www.bing.com/images/search?view=detailV2&ccid=Vsuep19E&id=C02A5AA38B66229189099E25200E6AB6EB849702&thid=OIP.Vsuep19EoMqnjMZfbpVkjgHaGS&mediaurl=https%3A%2F%2Fth.bing.com%2Fth%2Fid%2FR.56cb9ea75f44a0caa78cc65f6e95648e%3Frik%3DApeE67ZqDiAlng%26riu%3Dhttp%253a%252f%252fwww.jimpoz.com%252fproject50%252flegends%252fny.gif%26ehk%3DIkhqlFWQ7yExBc5c0nsooRyXKQDfBcOt84tp3t4FI5Q%253d%26risl%3D%26pid%3DImgRaw%26r%3D0&exph=225&expw=265&q=ny+state+and+new+jersey&simid=608043193223809129&form=IRPRST&ck=0E410F1830DD81F0D30FB7702168001C&selectedindex=3&ajaxhist=0&ajaxserp=0&pivotparams=insightsToken%3Dccid_vHUhtaU8*cp_CA822B73AC81B58CFDCEC675325EE59D*mid_72DD6C6C6B32F338AE8046A865D89423D7C3BBFE*simid_608047711526004650*thid_OIP.vHUhtaU8-DI!_Lxc1vDJ5TQAAAA&vt=0&sim=11&iss=VSI&ajaxhist=0&ajaxserp=0)
Long-term Trends
The data here show how COVID-19 has affected people in New York City since the city’s first confirmed case was diagnosed on February 29, 2020.
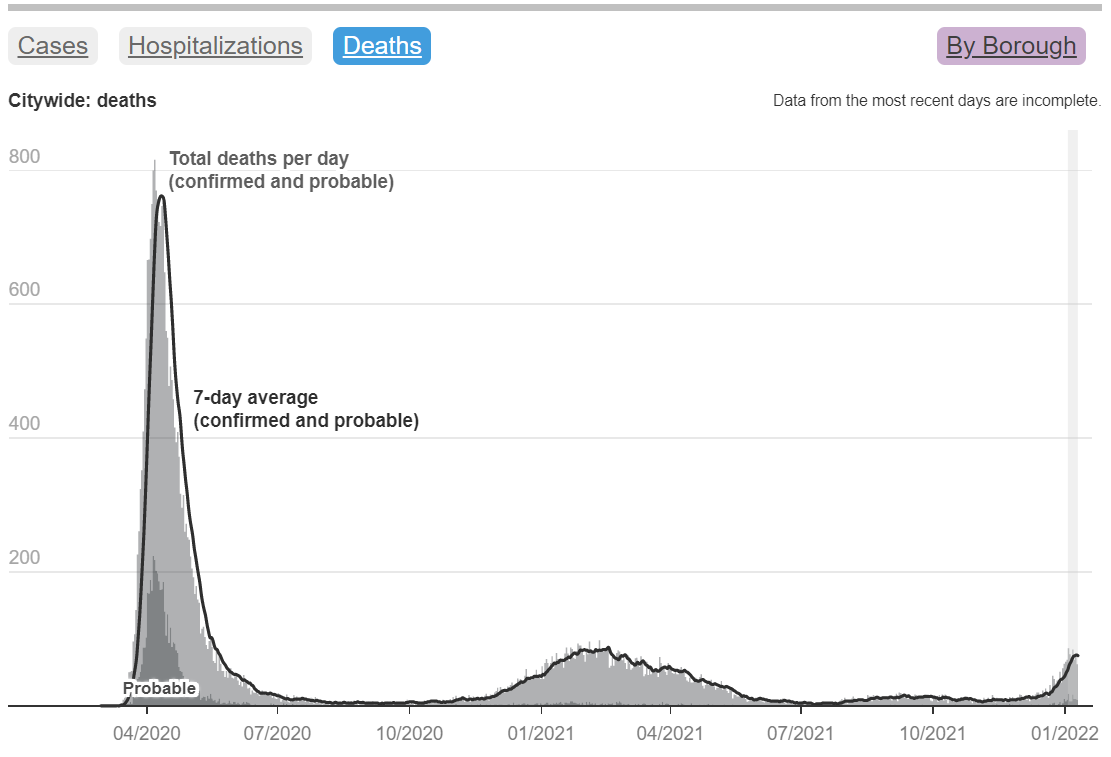
Cases, Hospitalizations and Deaths
These charts shows the daily number of confirmed and probable COVID-19 cases, hospitalizations and deaths by date that each occurred. You can also see monthly hospitalization and death rates by ZIP Code.
Due to delays in reporting, which can take as long as a week, recent data are incomplete.”
No comments:
Post a Comment