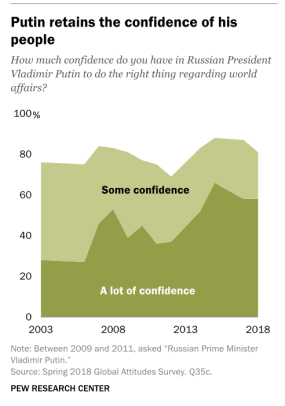
.
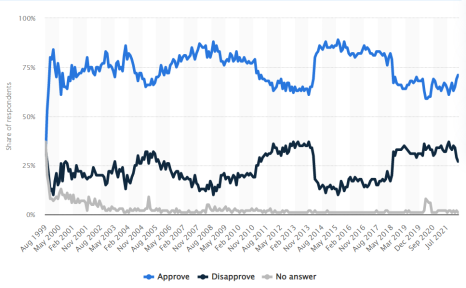
71% of Russians approve of Mr. Putin through Feb. 2022, per Statista and Levada. (Per NY Times, 2/4/22, “The Levada Center [is] one of the few independent pollsters in Russia." Levada is also a US government NED grantee: “The Yuri Levada Analytical Center, a NED grantee based in Moscow, is an independent polling agency that is well-known for its surveys on sociopolitical issues both within Russia and worldwide.”
3/2/2022, “Do you approve of the activities of Vladimir Putin as the president (prime minister) of Russia?" Statista
Above, Aug. 1999-Feb. 2022 (Chart is interactive at Statista site)
3/2/2022, “Vladimir Putin’s approval rating in Russia monthly 1999-2022″
.
.....
Added: From Levada website
71% of Russians approve activities of Mr. Putin as President of Russia, per Levada poll results published 2/18/22:
2/18/2022, “Approval of institutions, the state of affairs in the country, trust in politicians,” levada.ru/en
“Do you approve the activities of V. Putin as the President (Prime Minister) of Russia?”…
“In January [2022] the ratings of V. Putin, M. Mishustin, the State Duma and the Government of the Russian Federation have grown. Half of Russians believe that things in the country are going in the right direction."...
……………………………….
“Why the West loved Yeltsin and hates Putin," TheHindu.com, Vladimir Radyuhin, 3/20/2008, updated 10/9/2016
"Russians will remember Mr. Putin as the man who pulled the country from the brink of collapse....In Russia, Yeltsin is associated with plunging the country into chaos, reducing a majority of Russians to abject poverty and awarding the country’s oil, gas and other mineral riches to a handful of rapacious oligarchs.…
One reason why Yeltsin was the West’s darling-—while Mr. Putin is the target of virulent attacks-–was that his policies perfectly suited the Western agenda for Russia, a superpower-turned economic and military weakling, a subservient client state and a source of cheap energy and minerals.”…
………………………………………..
Added: From Statista, Levada is cited at #3:
“METHODOLOGICAL EXPLANATIONS
for the chart illustrating approval of the actions of the prime minister of Russia”
“1. The goal of the chart is to demonstrate the changes of declared approval of the actions of Russia’s prime minister by the residents of the Russian Federation older than 18 years of age in a more than 20-year period.
2. The approval level in all studies was measured via a dual-position scale comprising the responses, “approve” and “do not approve.” A respondent could select one of the two responses or decline to answer (at the result processing stage, this was considered “no response”).
3. The chart illustrates the results of national representative surveys conducted by the Levada Center team from January 1997 to now (for more information on sample building techniques see: https://www.levada.ru/en/methods/omnibus/). The question concerning approval of the prime minister’s actions was asked prior to 1997 as well, but irregularly (not every month), thus, the results from that previous period are not included in the final chart.
4. Over the reporting period, the approval survey was administered every month annually
with the exception of (no data):
• July 1997;
• January 1999;
• March 2008;
• April 2008.
5.
Depending on whoever was holding the office of Russia’s prime minister,
the question included the name of the specific prime minister at the
time of survey.
The table below provides a chronological list of the politicians in
question:
Politician’s full name Survey interval (in chronological order)
Viktor Chernomyrdin January 1997 – March 1998
Sergey Kiriyenko April 1998 – August 1998
Yevgeny Primakov October 1998 – April 1999
Sergey Stepashin May 1999 – July 1999
Vladimir Putin
Mikhail Kasyanov
Mikhail Fradkov
August 1999 – May 2000*
June 2000 – February 2004
March 2004 – September 2007
Viktor Zubkov
Vladimir Putin
Dmitry Medvedev
Mikhail Mishustin
October 2007 – February 2008
May 2008 – May 2012
June 2012 – December 2019
January 2020 – present
*The question was presented in the following (combined) form: “Overall, do you approve or disapprove of Vladimir Putin’s actions as prime minister and acting president of Russia?”
6. Until March 2020, the survey was conducted via personal interviews in the respondents’ homes (face-to-face). In April – June 2020, the survey was conducted via phone interviews (CATI).
7. The highest approval value in the reporting (accessible) period was recorded in September 2008 (Vladimir Putin’s premiership) – 88%. The lowest approval value (24%)
was recorded in June 1997 (Viktor Chernomyrdin’s premiership). It is
important to note, however, that it would be incorrect to interpret
these figures as the “historical maximum” or the “historical minimum,”
as any survey is subject to statistical error, which means that
deviations between 1 to 3 percentage points do not allow for changes to
be considered significant. In this case, for example, the value of 88%
does not differ from 86%.
8. Note that this measurement of politicians’ approval ratings is only one of the possible options. Sometimes, the question concerning the approval of the prime minister’s/president’s actions is administered with a four-position scale including the responses, “absolutely yes,” “mostly yes,” “mostly not,” or “absolutely not”. Additionally, approval is often mistakenly juxtaposed with another important indicator of assessing the actions of political institutions and figures – trust in politicians. Usually, questions about approval and trust are administered differently (and aimed at understanding different attitudes of the population), which should be taken into account. Thus, approval and trust figures should not be compared directly; instead, they should be considered as related indicators demonstrating changes (trends) in the public opinion.”
..........................
.........


No comments:
Post a Comment